2023-07-26 at 3:11 PM UTC
aldra
JIDF Controlled Opposition
there's no such thing as 'standard' deviations anymore
deviation is limitless
2023-07-26 at 4:26 PM UTC
I can't tell if this is a deliberately bad thread or if I'm just dumb. People need to stop making graphs.
Or like, people need to stop posting such fucking useless ones.
2023-07-26 at 4:28 PM UTC
The record high for Antarctic ice was set in 2014.
2023-07-26 at 4:32 PM UTC
aldra
JIDF Controlled Opposition
I'm not creating a twitter ('x') account to go check but I suspect he's misrepresenting the visual data, which the japanese research portal in the top link provides
https://www.climate.gov/news-features/understanding-climate/understanding-climate-antarctic-sea-ice-extentminimum is lower than usual but not dramatically lower
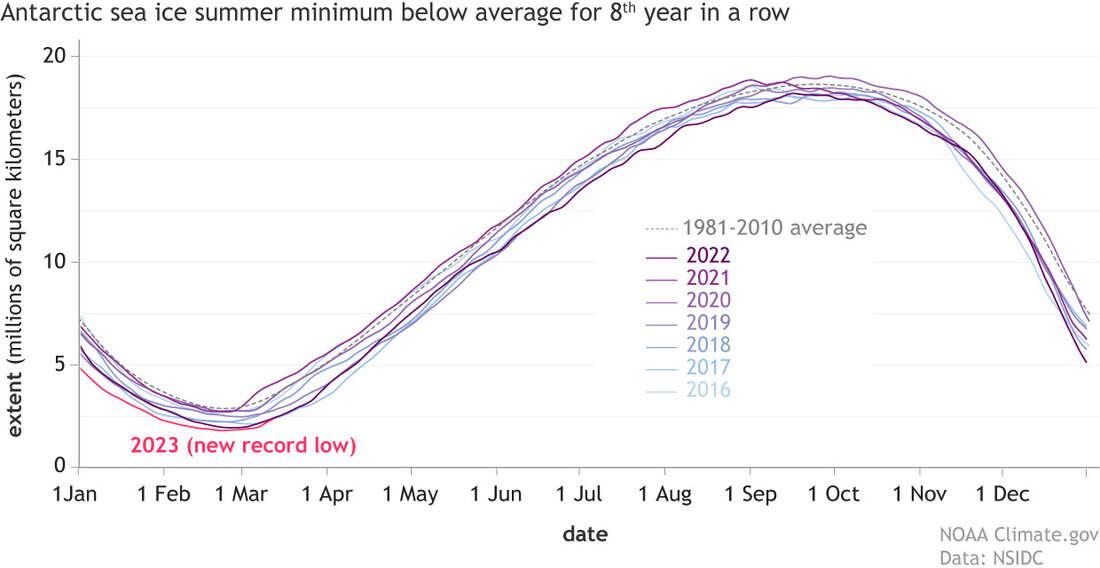
Each line shows daily sea ice extent—the total area at least 15% ice covered—in the Southern Ocean around Antarctica from 2016 (lightest blue) through 2023 (bright pink), which set a new record for smallest summer minimum. The summer minimums for the past eight years have all been below average (dotted line). This pattern is unusual, but still not statistically significant because of the wide range of historical variability.
The following users say it would be alright if the author of this
post didn't die in a fire!
2023-07-26 at 4:39 PM UTC
Originally posted by Donald Trump

Another poorly constructed graph.
How do you have -7 deviations
Zero deviations is zero...
The following users say it would be alright if the author of this
post didn't die in a fire!
2023-07-26 at 4:43 PM UTC
aldra
JIDF Controlled Opposition
more or less ice area, a deviation above or below
The following users say it would be alright if the author of this
post didn't die in a fire!
2023-07-26 at 4:55 PM UTC
-7 cups of ice isn't a big deal.
2023-07-26 at 5:37 PM UTC
In the '70s, and I was there, all you heard day and night from these clowns was how global cooling was going to destroy the entire planet, and how they needed more power and more money to stop it. When it never happened, they changed their pseudoscience to global warming. Then, when that never happened, they switched to climate change. That way, they could cry the sky was falling no matter what the weather ends up being.
The following users say it would be alright if the author of this
post didn't die in a fire!